
dolinak
Nov 19, 2024
How to make a live stock app using websocket.
Lets learn how to make a live stock app with websocket
Create Vue App
First, we're going to begin our project by creating a straightforward Vue application. This initial step forms the foundation of our work and provides us with a basic structure to build upon. Vue, being a highly efficient and progressive framework, will serve as an excellent tool for developing our application.
npm create vue@latest
After executing the command npm create vue@latest, the system will initiate an interactive session. During this session, you'll be prompted to provide a unique name for your new project. Additionally, you'll be guided through some initial setup tasks to configure and personalize your Vue application according to your preferences and project requirements.
Once you have successfully created the Vue folder, navigate to its location within your directory. Once you've found it, open it up. Now, you're going to want to execute the next step within this newly created Vue folder. To do this, you'll need to run the following command:
npm install
In order to integrate real-time functionality into your Vue project, you will need to install PieSocket. PieSocket is an efficient service that provides WebSocket API for your applications, and installing it is a straightforward process. Once installed, you can use PieSocket to add real-time updates and interactive features to your Vue project, enhancing its functionality and user experience.
npm i piesocket-js@5
Go to PIeHost.com and create an account there and get the cluster_key and api_key from there
Let's Install Chart-js
npm install chart.js
Let's Get Into The Code
  data() {
    return {
      stockSymbol: "IBM",
      stockMarketHistoryDates: [],
      stockMarketHistoryPrices: [],
    };
  },
These properties are used throughout the component to fetch data, update the chart, and keep track of the currently displayed stock. When the user enters a new stock symbol, stockSymbol is updated, which triggers a new fetch of data and an update of the chart. The dates and prices are also updated whenever new data is fetched from the API. This keeps the chart in sync with the current state of the component.
createChart() {
      const ctx = document.getElementById("myChart");
      myChart = new Chart(ctx, {
        type: "line",
        data: {
          labels: this.stockMarketHistoryDates,
          datasets: [
            {
              label: "Stock Market Price",
              data: this.stockMarketHistoryPrices,
              fill: false,
              borderColor: "rgb(75, 192, 192)",
              tension: 0,
              options: {
                responsive: true,
                maintainAspectRatio: false,
              },
            },
          ],
        },
      });
    },
The function that creates a line chart using Chart.js is createChart(). Let me walk you through its magic:
At first, it identifies the canvas element within the mystical realms of the Document Object Model bearing the unique identifier "myChart" by calling upon the almighty document.getElementById("myChart"). The next step is to instantiate a new Chart.js chart and store it in the variable myChart. The chart is customized with the following settings:
- type: "line": This option indicates that the chart should be displayed as a line chart.
- data: It is an object which carries the information meant for display on the chart. This object has two primary attributes: labels: It is configured to be this.stockMarketHistoryDates, which is an array of dates showing historical stock market data. The datasets are represented as an array of objects where each object contains the data points for a specific dataset to be plotted on the chart. However, in this particular instance, there exists only one dataset within this array and it is set up with various properties:
labels: These are set to this.stockMarketHistoryDates, an array of dates relating to the historical stock market information. datasets: This array is composed of individual objects that stand for a specific data set intended for display on the chart. There is only one dataset here but it is structured with multiple settings:
- label: "Stock Market Price": A label to be shown in the legend and tooltips that represent this dataset.
- data: this.stockMarketHistoryPrices: An array of prices that will be displayed on the chart. These prices align with the dates listed in this.stockMarketHistoryDates. Not filling under the line can be done by using - fill: false. The color of the line can be specified by - borderColor: "rgb(75, 192, 192)". In terms of setting the amount of bezier curve tension — which affects how curved the line is between points — it can be set with - tension: 0.optionsThis object contains additional configuration options for the chart. In this case, it’s set to be responsive and not maintain the aspect ratio.
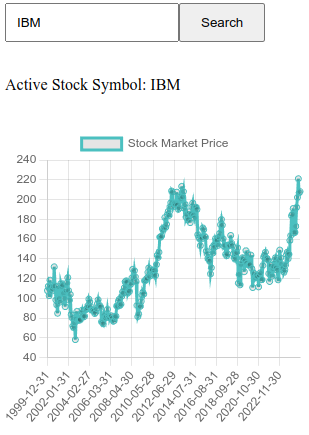
In summary, the createChart() method creates a line chart that plots the historical stock market prices for a given stock symbol against the dates of those prices. The chart is responsive and does not maintain its aspect ratio, meaning it will resize based on its container’s size. The line on the chart is colored light blue and does not fill the area underneath it. The chart is initially created when the component is mounted and is updated whenever new data is fetched from the API.
    updateChart() {
      myChart.data.labels = this.stockMarketHistoryDates;
      myChart.data.datasets[0].data = this.stockMarketHistoryPrices;
      myChart.update();
    },
The updateChart() method is used to update the line chart with the latest stock market data. Here’s a breakdown of its functionality:
- myChart.data.labels = this.stockMarketHistoryDates;: This line updates the x-axis of the chart (the labels) with the new dates from this.stockMarketHistoryDates.
- myChart.data.datasets[0].data = this.stockMarketHistoryPrices;: This line updates the y-axis of the chart (the data of the first dataset) with the new prices from this.stockMarketHistoryPrices.
- myChart.update();: This line redraws the chart with the new data and labels.
In summary, whenever new stock data is fetched, this method is called to update the chart. It ensures that the chart always displays the most recent data. This is crucial for providing users with real-time updates on stock market prices. The chart is redrawn efficiently, avoiding unnecessary re-renders. This is thanks to the efficient updating mechanism of Chart.js, a powerful library for creating dynamic charts.
connectToPieSocket() {
      let piesocket = new PieSocket({
              clusterId: "YOUR CLUSTER ID",
        apiKey: "YOUR API KEY",
        notifySelf: true,
        presence: true,
        userId: "user_" + Math.floor(Math.random() * 1000),
      });

      piesocket.subscribe("stock-data").then((ch) => {
        channel = ch;
        ch.listen("new_stock_data", (data) => {
          this.stockSymbol = data.symbol;
          this.stockMarketHistoryDates = data.dates;
          this.stockMarketHistoryPrices = data.prices;
          this.updateChart();
          console.log(
            this.stockSymbol,
            this.stockMarketHistoryDates,
            this.stockMarketHistoryPrices
          );
        });

        document
          .getElementById("stockSymbolSearchForm")
          .addEventListener("submit", (event) => {
            event.preventDefault();
            this.fetchAndPublishStockData();
          });
      });
    },
The connectToPieSocket() method is responsible for establishing a real-time connection with PieSocket, a WebSocket API service. Here’s a breakdown of its functionality:
- It first creates a new PieSocket instance with specific options such as clusterId, apiKey, notifySelf, presence, and userId.
- It then subscribes to a channel named “stock-data” on PieSocket. Once the subscription is successful, it assigns the channel to a variable named channel.
- It sets up a listener on the channel for “new_stock_data” events. When such an event occurs, it updates the stockSymbol, stockMarketHistoryDates, and stockMarketHistoryPrices properties with the new data, and then calls this.updateChart() to update the chart with the new data.
- It also sets up an event listener on the “submit” event of the form with the id “stockSymbolSearchForm”. When the form is submitted, it prevents the default form submission behavior and calls this.fetchAndPublishStockData() to fetch and publish new stock data based on the current stockSymbol.
In summary, the connectToPieSocket() method establishes a real-time connection with PieSocket, listens for new stock data, updates the chart with the new data, and handles form submissions to fetch and publish new stock data. This method is crucial for providing real-time updates on stock market prices to the user.
fetchAndPublishStockData() {
      let AlphaVantageAPI_URL_LINK =
        "<https://www.alphavantage.co/query?function=TIME_SERIES_MONTHLY_ADJUSTED&symbol=>" +
        this.stockSymbol +
        "&apikey=6S3XWKYVUZIUJZEF";

      axios.get(AlphaVantageAPI_URL_LINK).then((response) => {
        let stockMarketHistory = response.data["Monthly Adjusted Time Series"];
        let stockMarketHistoryDates = [];
        let stockMarketHistoryPrices = [];

        for (const property in stockMarketHistory) {
          let closingPrice = stockMarketHistory[property]["4. close"];
          let closingDate = property;
          stockMarketHistoryDates.unshift(closingDate);
          stockMarketHistoryPrices.unshift(closingPrice);
        }

        channel.publish("new_stock_data", {
          symbol: this.stockSymbol,
          dates: stockMarketHistoryDates,
          prices: stockMarketHistoryPrices,
        });
      });
    },
The fetchAndPublishStockData() method is responsible for fetching stock market data from the Alpha Vantage API and publishing it to a PieSocket channel. Here's a breakdown of its functionality:
- It constructs the URL for the Alpha Vantage API request. The URL includes the function (TIME_SERIES_MONTHLY_ADJUSTED), the stock symbol (this.stockSymbol), and the API key.
- It sends a GET request to the Alpha Vantage API using axios. When the promise resolves, it processes the response:
- It extracts the "Monthly Adjusted Time Series" data from the response.
- It initializes two empty arrays, stockMarketHistoryDates and stockMarketHistoryPrices, to hold the dates and closing prices of the stock market history.
- It iterates over the stock market history data. For each entry, it extracts the closing price and the date, and unshifts (prepends) them to the respective arrays.
- It publishes the new stock data to the PieSocket channel. The data includes the stock symbol, the dates, and the prices.
In summary, the fetchAndPublishStockData() method fetches monthly adjusted time series data for a given stock symbol from the Alpha Vantage API, processes the data to extract the dates and closing prices, and publishes this data to a PieSocket channel. This method is called when the component is mounted and whenever the user submits a new stock symbol. This ensures that the chart always displays the most recent data for the selected stock.
Change your App.vue like this:
<template>
  <div class="lineChart">
    <div class="chartAndButtonsContainer">
      <form @submit.prevent="fetchAndPublishStockData" id="stockSymbolSearchForm">
        <input
          type="text"
          name="stockSymbolSearch"
          placeholder="Enter the symbol of the stock you want to search"
          id="stockSymbolSearchBar"
          v-model="stockSymbol"
        />
        <button type="submit" class="submit">Search</button>
      </form>
      <br />
      <p>Active Stock Symbol: {{ stockSymbol }}</p>
      <br />
      <div id="chartContainer">
        <canvas id="myChart" width="400px" height="400px"></canvas>
      </div>
    </div>
  </div>
</template>

<script>
import { ref, computed } from "vue";
import Chart from "chart.js/auto";
import axios from "axios";
import PieSocket from "piesocket-js";

let myChart;
let channel;
export default {
  name: "LineChart",
  data() {
    return {
      stockSymbol: "IBM",
      stockMarketHistoryDates: [],
      stockMarketHistoryPrices: [],
    };
  },
  mounted() {
    this.createChart();
    this.connectToPieSocket();
  },
  methods: {
    createChart() {
      const ctx = document.getElementById("myChart");
      myChart = new Chart(ctx, {
        type: "line",
        data: {
          labels: this.stockMarketHistoryDates,
          datasets: [
            {
              label: "Stock Market Price",
              data: this.stockMarketHistoryPrices,
              fill: false,
              borderColor: "rgb(75, 192, 192)",
              tension: 0,
              options: {
                responsive: true,
                maintainAspectRatio: false,
              },
            },
          ],
        },
      });
    },
    updateChart() {
      myChart.data.labels = this.stockMarketHistoryDates;
      myChart.data.datasets[0].data = this.stockMarketHistoryPrices;
      myChart.update();
    },
    connectToPieSocket() {
      let piesocket = new PieSocket({
        clusterId: "YOUR CLUSTER ID",
        apiKey: "YOUR API KEY",
        notifySelf: true,
        presence: true,
        userId: "user_" + Math.floor(Math.random() * 1000),
      });

      piesocket.subscribe("stock-data").then((ch) => {
        channel = ch;
        ch.listen("new_stock_data", (data) => {
          this.stockSymbol = data.symbol;
          this.stockMarketHistoryDates = data.dates;
          this.stockMarketHistoryPrices = data.prices;
          this.updateChart();
          console.log(
            this.stockSymbol,
            this.stockMarketHistoryDates,
            this.stockMarketHistoryPrices
          );
        });

        // Fetch initial stock data
        this.fetchAndPublishStockData();
      });
    },
    fetchAndPublishStockData() {
      if (!channel) {
        console.error("Channel is not initialized yet.");
        return;
      }

      let AlphaVantageAPI_URL_LINK =
        "https://www.alphavantage.co/query?function=TIME_SERIES_MONTHLY_ADJUSTED&symbol=" +
        this.stockSymbol +
        "&apikey=6S3XWKYVUZIUJZEF";

      axios.get(AlphaVantageAPI_URL_LINK).then((response) => {
        let stockMarketHistory = response.data["Monthly Adjusted Time Series"];
        let stockMarketHistoryDates = [];
        let stockMarketHistoryPrices = [];

        for (const property in stockMarketHistory) {
          let closingPrice = stockMarketHistory[property]["4. close"];
          let closingDate = property;
          stockMarketHistoryDates.unshift(closingDate);
          stockMarketHistoryPrices.unshift(closingPrice);
        }

        channel.publish("new_stock_data", {
          symbol: this.stockSymbol,
          dates: stockMarketHistoryDates,
          prices: stockMarketHistoryPrices,
        });
      });
    },
  },
};
</script>

<style scoped>
#chartContainer {
  width: 1000px;
  height: 300px;
  margin: 0 auto;
}
#stockSymbolSearchBar {
  padding: 10px;
}
#stockSymbolSearchForm .submit {
  padding: 10px 20px;
}
</style>
Now just run your app with:
npm run dev
Complete Code
The project is available on our GitHub : https://github.com/piehostHQ/stock-app